Blog post
How to use Pivot Tables in business

By Chris Onslow 02 Oct 2023
Pivot tables are a powerful tool in business for analyzing and summarizing large amounts of data. Here are the steps to use pivot tables effectively:
1. Identify the data: Determine the dataset you want to analyze. This could be sales data, customer information, financial data, or any other relevant information.
2. Organize the data: Ensure that your data is well-structured and organized. Each column should represent a specific attribute or variable, and each row should contain a unique record.
3. Select the data range: Highlight the entire dataset, including the column headers, by clicking and dragging the cursor over the range of cells.
4. Create a pivot table: Go to the "Insert" tab in Excel (or any other spreadsheet software) and click on "PivotTable." A dialog box will appear, allowing you to choose the location of the pivot table (either a new worksheet or an existing one).
5. Choose the fields: In the pivot table field list, you will see all the column headers from your dataset. Drag and drop the relevant fields into the "Rows," "Columns," and "Values" areas. For example, if you want to analyze sales by region and product category, drag the "Region" field to the "Rows" area and the "Product Category" field to the "Columns" area. Then, drag the "Sales" field to the "Values" area.
6. Customize the pivot table: You can further customize the pivot table by right-clicking on any cell and selecting options such as sorting, filtering, and formatting. You can also change the summary function (e.g., sum, average, count) for each value field.
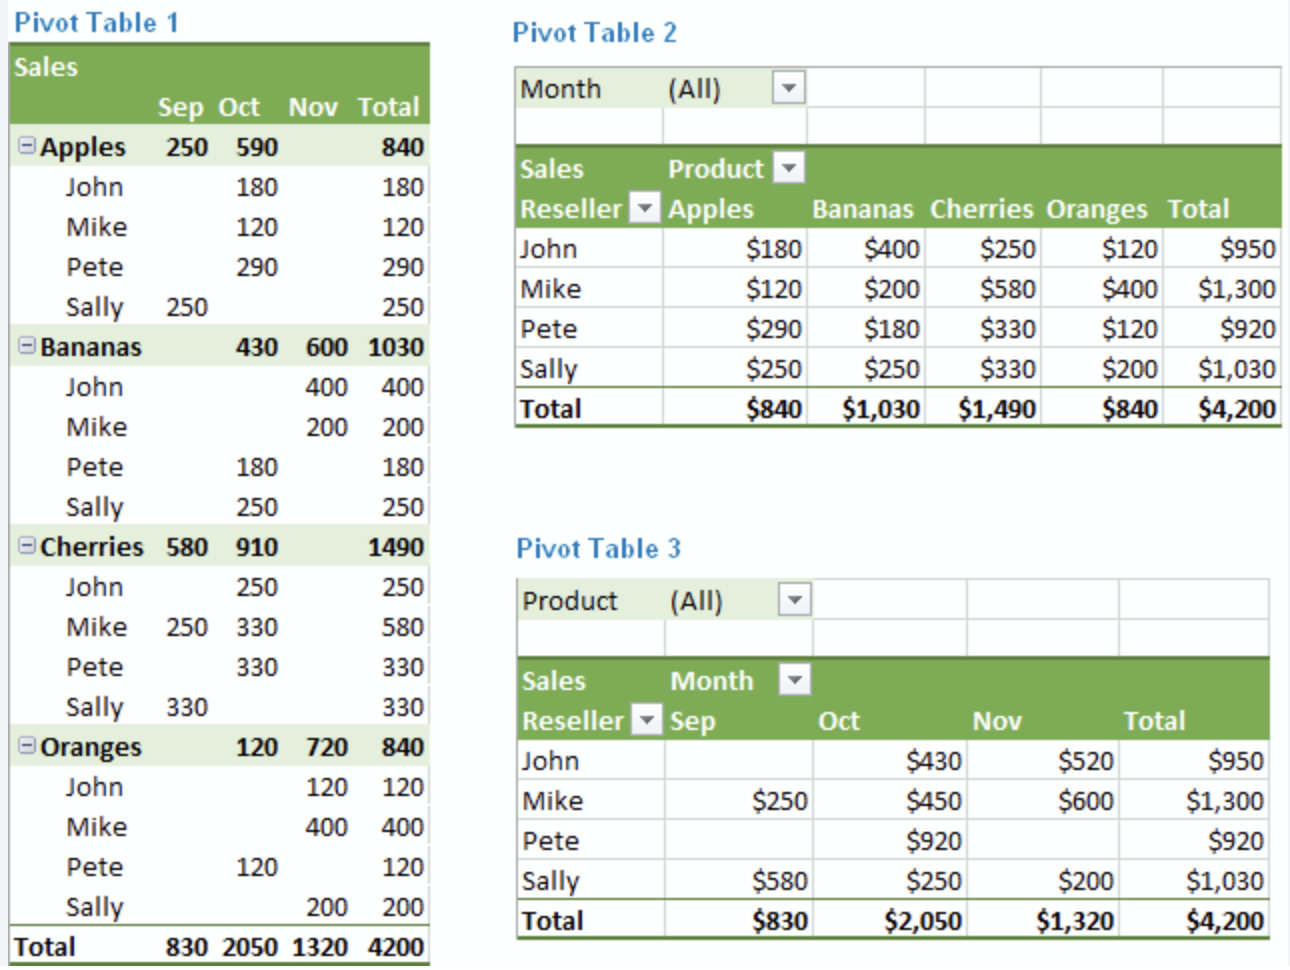
7. Analyze the data: Once the pivot table is created, it will automatically summarize and aggregate the data based on the selected fields. You can easily change the layout and rearrange the fields to gain different insights. For example, you can switch the rows and columns to view sales by product category and region.
8. Apply filters: Pivot tables allow you to filter the data based on specific criteria. You can apply filters to individual fields or use the "Report Filter" area to filter the entire pivot table. This helps in drilling down into specific subsets of data for deeper analysis.
9. Refresh the pivot table: If your dataset changes or new data is added, you need to refresh the pivot table to update the analysis. This can be done by right-clicking on the pivot table and selecting "Refresh" or by using the refresh button in the pivot table toolbar.
10. Create pivot table reports: Once you have analyzed the data, you can create reports or charts based on the pivot table. This allows you to present the summarized information in a visually appealing and easy-to-understand format.
By using pivot tables, businesses can quickly analyze and gain insights from large datasets, make data-driven decisions, and identify trends and patterns that can drive business growth and efficiency.
To view our Pivot Tables training course please click here